Similar Chart Search Results


※ Update Date : 2025-06-23
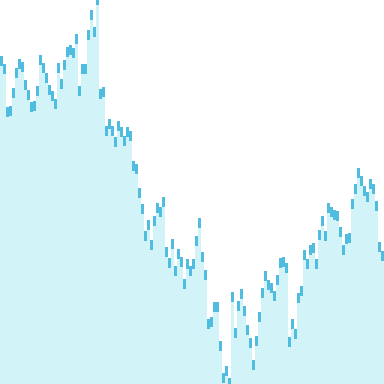
Alphabet Inc Class A (GOOGL)
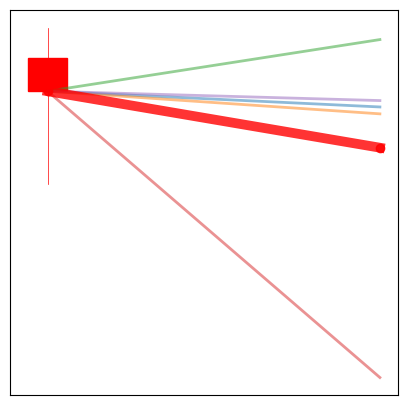
Future Trends from 50 Similar Past Charts
16-Trading Day Comparison : 10
32-Trading Day Comparison : 10
64-Trading Day Comparison : 10
128-Trading Day Comparison : 10
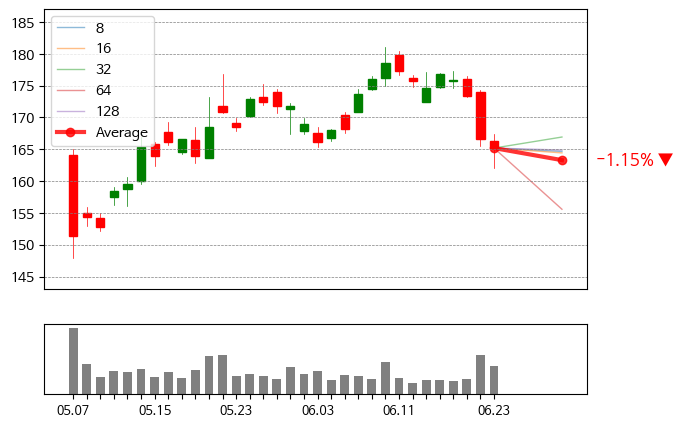
Average Future Change of Similar Charts : -1.15% ▼
Chart Score
Similar past charts show a balanced ratio of rises and drops.
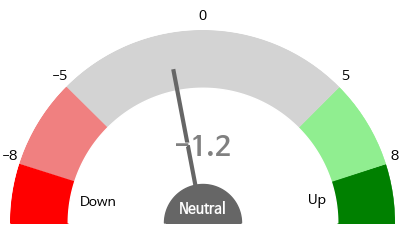
Score : -1.15 X 0.7 + (48.0 - 50) X 0.2 + (0.0) = -1.2
Rising Ratio After 10 Days Score 6 or more : 56.89 %
>> View Detailed Probability by Score Range
of Similar Charts
-1.15% ▼
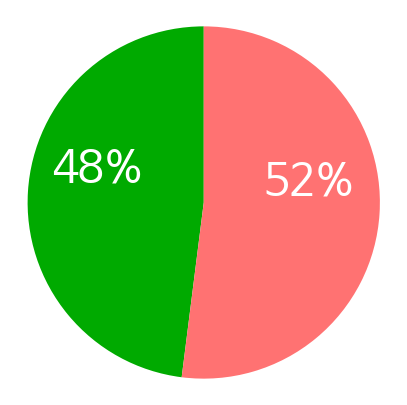
(24/50)
48.0%
Past performance is not indicative of future results. All investment decisions should be made by the investor at their own risk.
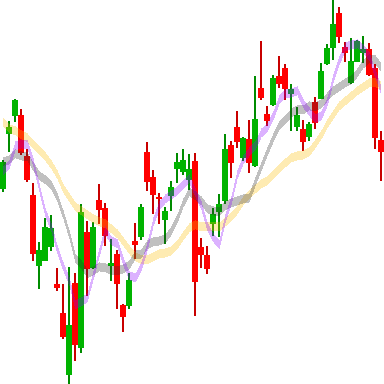
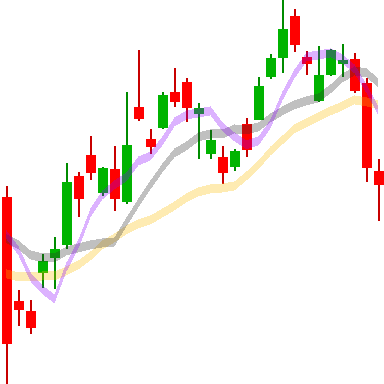
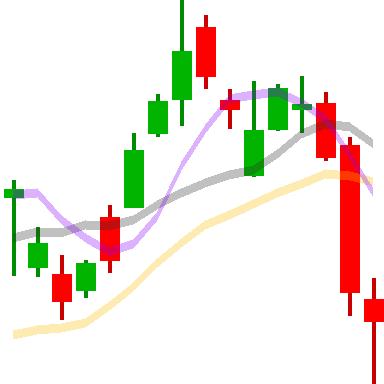
Detailed Comparison
Rising Stock : 3 / 10
Rising Stock : 4 / 10
Rising Stock : 7 / 10
Rising Stock : 4 / 10
Rising Stock : 6 / 10
Click on the chart image to see similar charts.
| Related Stocks | ||||
|---|---|---|---|---|
| Meta Platforms Inc | Visa Inc | Mastercard Inc | ||
| Alphabet Inc Class C | Netflix Inc | Alibaba Group Holding Ltd ADR | ||
| PDD Holdings Inc ADR | Shopify Inc | MercadoLibre Inc | ||