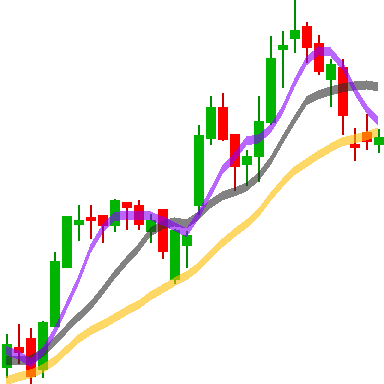
Similar Chart Finder
NYSE & NASDAQ
Supported stocks will appear in the autocomplete list when you enter text.
It supports the top 2000 stocks listed NYSE and Nasdaq, exploring all charts from the last 10 years.
It supports comparison for 8, 16, 32, 64, and 128 trading days.
All latest data will be updated everyday within 3 hours after the market closes.
Only stocks are supported; ETFs and ETNs are not supported.
※ Latest Update Date : 2026-06-26
2026-06-26
Market Sentiment
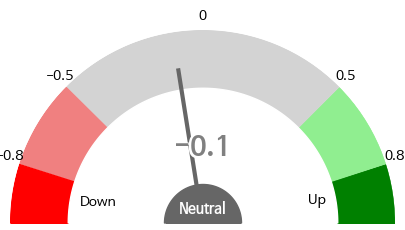
Average Score for All Stocks : -0.1
| Item Name | Future Average Change | Rising Chart Rate |
|---|---|---|
| 1. Bloom Energy Corp | -0.11% ▼ | 52% |
| 2. Eli Lilly and Co | 0.61% ▲ | 48% |
| 3. Moderna Inc | 0.19% ▲ | 48% |
| 4. Sellas Life Sciences Group Inc | -0.27% ▼ | 46% |
| 5. Lucid Group Inc | -0.59% ▼ | 44% |
| 6. Moderna Inc | 0.19% ▲ | 48% |
| 7. Immunitybio Inc | -1.62% ▼ | 42% |
| 8. CCC Intelligent Solutions Holdings Inc | 0.82% ▲ | 52% |
| 9. Maase Inc | -2.1% ▼ | 52% |
| 10. ON Semiconductor Corp | 0.5% ▲ | 42% |
| 1. Fuelcell Energy Inc | -0.94% ▼ | 48% |
| 2. Sellas Life Sciences Group Inc | -0.27% ▼ | 46% |
| 3. Lucid Group Inc | -0.59% ▼ | 44% |
| 4. AtaiBeckley Inc | 1.34% ▲ | 57% |
| 5. Intapp Inc | 0.42% ▲ | 44% |
| 6. Moderna Inc | 0.19% ▲ | 48% |
| 7. Damora Therapeutics Inc | 3.67% ▲ | 65% |
| 8. Immunitybio Inc | -1.62% ▼ | 42% |
| 9. CCC Intelligent Solutions Holdings Inc | 0.82% ▲ | 52% |
| 10. GH Research PLC | 1.43% ▲ | 56% |
| 1. Maase Inc | -2.1% ▼ | 52% |
| 2. ON Semiconductor Corp | 0.5% ▲ | 42% |
| 3. Bloom Energy Corp | -0.11% ▼ | 52% |
| 4. Regencell Bioscience Holdings Ltd | 5.4% ▲ | 68% |
| 5. Western Digital Corp | -0.48% ▼ | 52% |
| 6. Capricor Therapeutics Inc | 0.01% ▲ | 50% |
| 7. Seagate Technology Holdings PLC | 0.34% ▲ | 54% |
| 8. FormFactor Inc | 1.49% ▲ | 52% |
| 9. Transmedics Group Inc | -2.0% ▼ | 40% |
| 10. Credo Technology Group Holding Ltd | 0.36% ▲ | 56% |
※ Future Average Change : Average future change of similar charts
※ Rising Chart Rate : Rate of similar charts that rise in the future